


What’s in this guide
- What is a trading strategy?
- Why structure comes before strategy
- The four main types of beginner strategy
- Strategy 1: The Breakfast Breakout
- Strategy 2: The T-Wave Strategy
- Building the habit, not just the trade
- Frequently asked questions
- Glossary
The global foreign exchange market now trades $9.6 trillion a day. That’s a 28% jump from $7.5 trillion just three years earlier, according to the Bank for International Settlements’ 2025 Triennial Central Bank Survey, the most comprehensive dataset on FX activity in existence.¹ That scale can make trading feel intimidating for anyone starting out.
But the opportunity for a beginner isn’t in trying to predict where a market is headed next. It’s in following a process that’s clear enough to repeat, trade after trade, without needing years of chart-reading instinct. This guide explains what a trading strategy actually is, walks through the main categories beginners will encounter, and then goes deep on two rules-based strategies we teach at LearnToTrade.
What is a trading strategy?
A trading strategy is a defined set of rules that tells you three things before you place a trade. This simply outlines where you get in, where you get out if you’re wrong, and where you get out if you’re right.
Everything else, from the analysis, to the chart reading, and the market commentary, exists to serve those three decisions.
It’s worth separating this from a trading style, which is a broader description of how often and over what timeframe you trade. Day trading, swing trading and position trading are styles. The Breakfast Breakout is a strategy. You can run several strategies within a single style, and the same strategy can sometimes be adapted across styles.
The distinction matters for beginners because a lot of trading content sells a style (“become a day trader”) without ever providing the rules that make it executable. A strategy without defined entry, exit and risk parameters isn’t a strategy. It’s a guess with extra steps.
Why structure comes before strategy
Before we get into the strategies themselves, it’s worth understanding why risk management sits at the centre of everything we teach.
In October 2025, the UK’s Financial Conduct Authority (FCA) issued a warning about the risks associated with Contracts for Difference (CFDs), describing them as complex, high-risk products.² The FCA also pointed to the tangible value of the protections currently in place for retail traders: leverage limits and client loss protections prevent nearly 400,000 people a year from losing more than their original stake, representing an estimated £267 million to £451 million in protection annually.²
We see this as validation of an approach we’ve built into every strategy from day one: capping risk at a small, fixed percentage of the account on every single trade, and defining a stop loss before the trade is ever placed. It’s not a reaction to the FCA’s warning. It’s the same principle regulators are pointing to as best practice.
Our standard rule is a maximum of 2% of account equity at risk on any single trade. On a £10,000 account, that means the distance between your entry and your stop loss should never represent more than £200 of exposure. If a strategy setup requires you to breach that, you don’t take a smaller stop. Instead, you skip the trade.
The four main types of beginner strategy
Most beginner-appropriate strategies fall into one of four broad families. Understanding the categories helps you recognise what a strategy is trying to exploit, rather than memorising steps by rote.
Breakout strategies trade the moment price escapes an established range, on the assumption that the move will continue in that direction. They work best when a market has been consolidating and is due a decisive move. For example, after an opening period or ahead of scheduled news.
Trend-following strategies identify a market already moving in one direction and look to join it, rather than trying to call the turn. They accept that you’ll never catch the exact bottom or top, in exchange for trading with the prevailing momentum.
Range or mean-reversion strategies do the opposite: they assume price will return towards an average after moving too far from it, and trade the bounces between support and resistance. These suit markets moving sideways rather than trending.
Momentum strategies look for acceleration in price and volume, entering on strength and exiting when that strength fades. They tend to demand faster decision-making, which makes them a harder starting point for most beginners.
The two strategies below are our flagship beginner methods, and they sit in the first two families, one breakout and one trend-following. We teach these first because both can be executed to a written checklist, with no discretionary interpretation required.
Strategy 1: The Breakfast Breakout
The Breakfast Breakout is designed for trading stock indices and commodities, and it’s built around a simple, observable pattern in how markets behave.
When a market opens, traders spend the first hour digesting everything that happened while it was closed. This includes reviewing economic data, overnight news, positioning from other sessions.
That price discovery process creates a range: a floor and a ceiling, formed entirely within the first hour of trading. On SmartCharts, this channel is drawn automatically on the 5-minute chart, so you can see the floor and ceiling at a glance rather than having to plot it yourself.
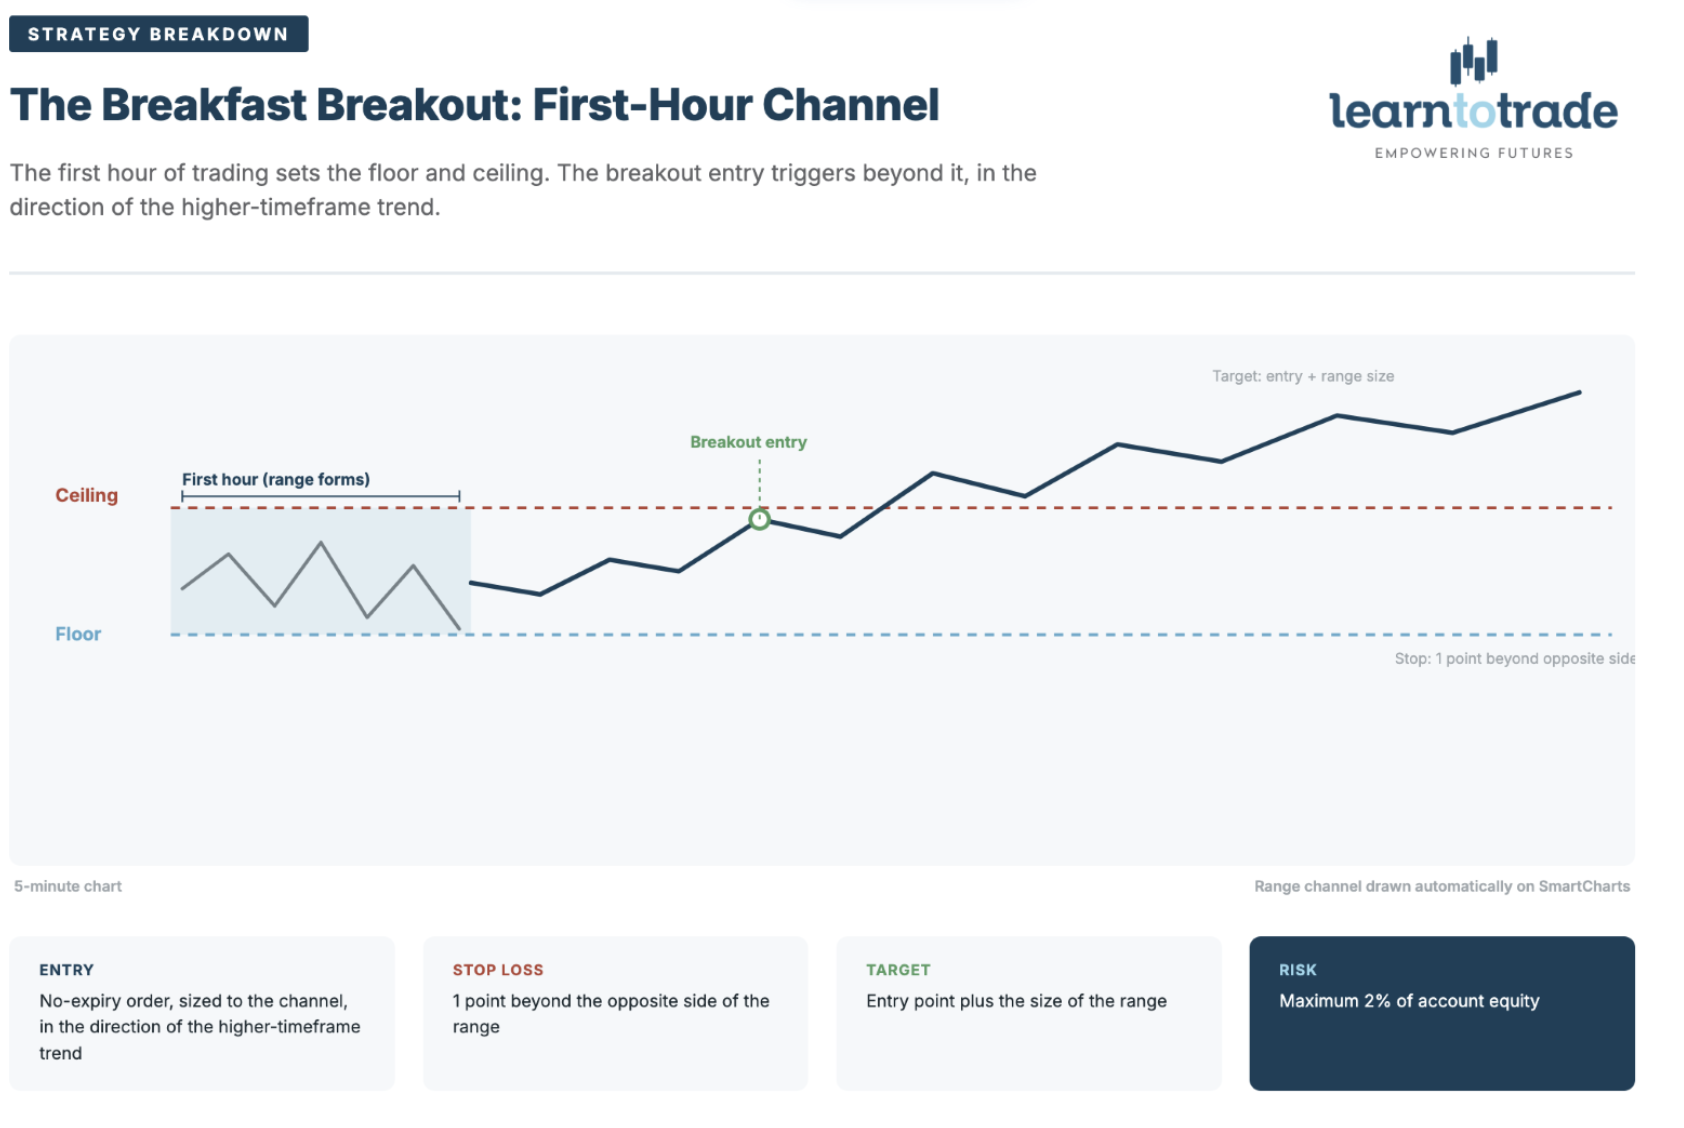
Before acting on that range, we check a higher timeframe, the 4-hour or daily chart, to understand the broader trend. The 5-minute chart might suggest a market is climbing, but if the daily chart shows it’s still in a longer-term downtrend, that’s a signal to be cautious about trading the breakout upward. The idea is to trade with the tide, not against it.
Once the range and the higher-timeframe trend are established, the trade itself is simple:
| Component | Rule |
| Entry | A no-expiry order set to trigger on a breakout the same size as the channel, in the direction of the higher-timeframe trend |
| Stop loss | 1 point beyond the opposite side of the range |
| Target | Entry point plus the size of the range |
| Risk | Maximum 2% of account equity |
Because the order has no expiry, it stays live until it either triggers or you cancel it. This is why we recommend setting a reminder to check back in and cancel the order if the breakout hasn’t happened by the end of the session.
Why it suits beginners: there’s very little left to interpretation. The channel is drawn for you, the entry and exit levels are calculated from it, and the higher-timeframe check keeps you from trading against the broader trend.
Strategy 2: The T-Wave Strategy
Where the Breakfast Breakout is about catching a market as it breaks out of a range, the T-Wave Strategy is about following a trend that’s already established, and waiting for confirmation before you commit.
The first step is identifying the trend itself.
We use two exponential moving averages: an 8 EMA and a 20 EMA.
When the 8 EMA sits above the 20 EMA, that’s a good indicator of an uptrend (the logic simply reverses for a downtrend). As with the Breakfast Breakout, it’s worth checking a longer timeframe for additional context on the strength of that trend, if you’re working on a 1-hour chart, the 4-hour or daily will tell you whether you’re trading with or against the wider move.
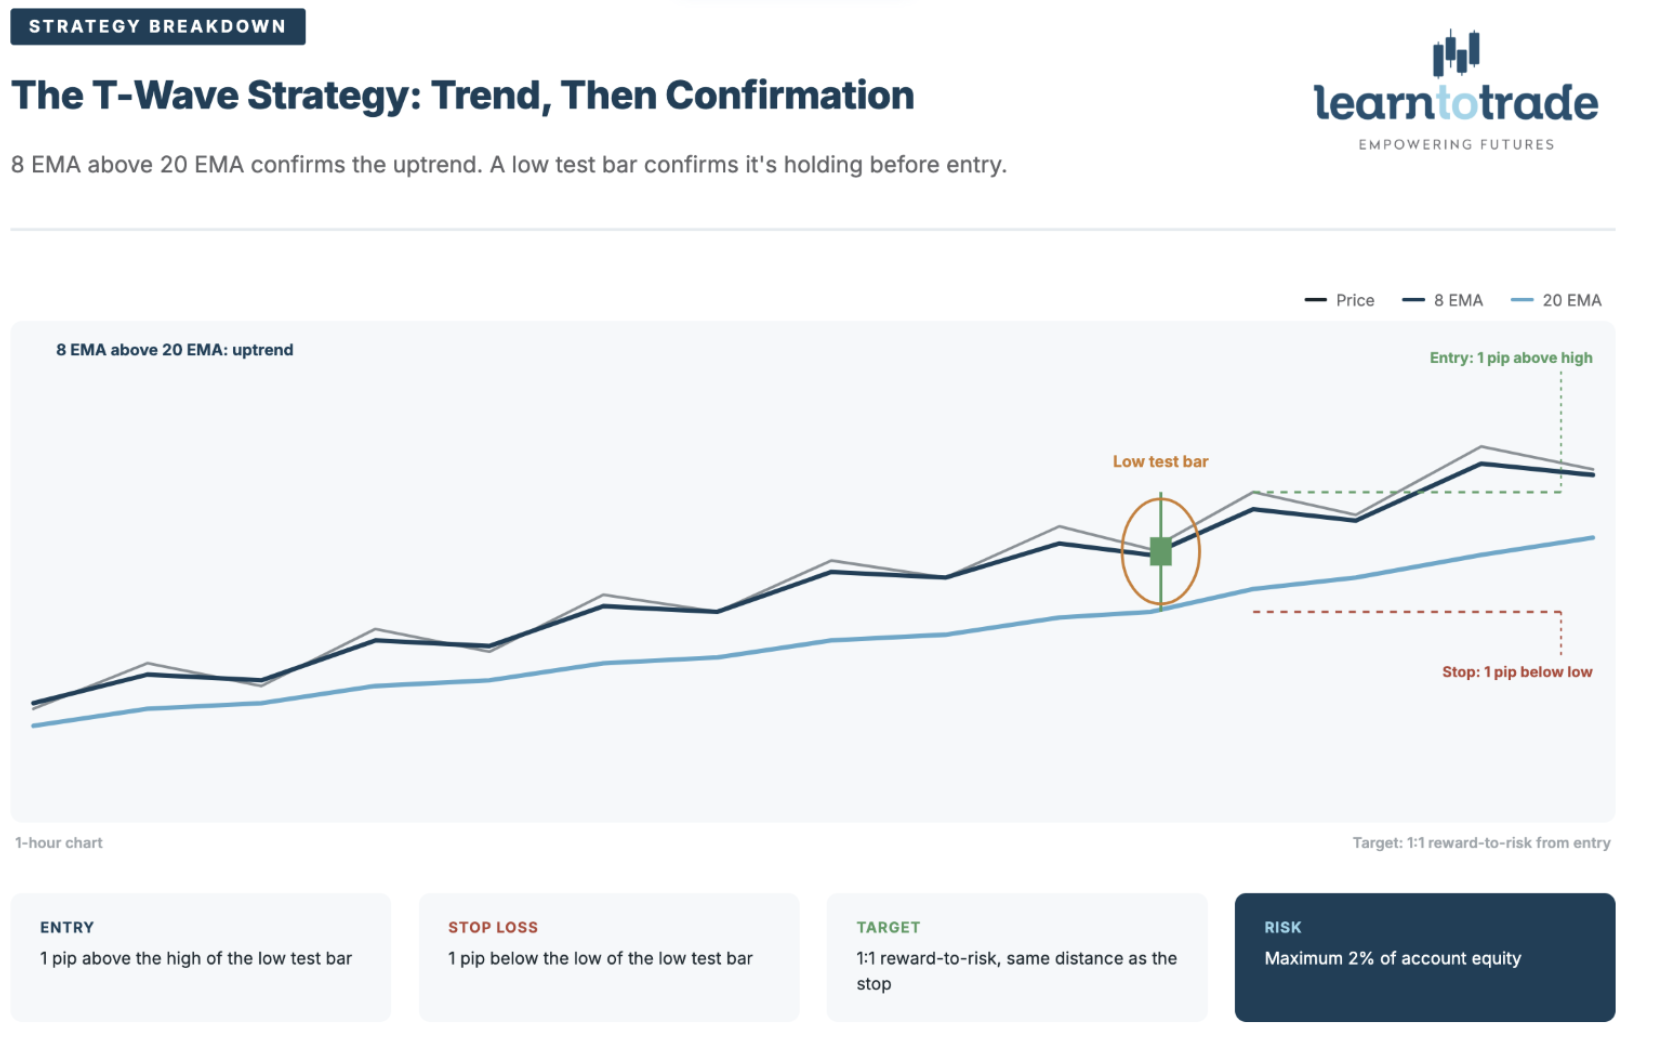
Once the trend is confirmed, we look for a specific bar pattern called a low test bar. This is a bar where the open and close both sit in the upper half of the price range. This tells us the market tested a potential reversal and rejected it, which is a strong signal the existing trend is likely to continue rather than turn. Since price has to move in one direction or the other, a failed test to the downside is meaningful information for the whole market, not just for us.
From there, the trade is set up around the size and position of that confirmation bar:
| Component | Rule |
| Entry | 1 pip above the high of the low test bar |
| Stop loss | 1 pip below the low of the low test bar |
| Target | 1:1 reward-to-risk. The same distance above entry as the stop is below it |
| Risk | Maximum 2% of account equity |
Why it suits beginners: it builds in patience. Rather than acting the moment a trend appears to be forming, you wait for the market to prove itself first. That single habit is one of the most valuable disciplines a new trader can develop.
Building the habit, not just the trade
What both of these strategies have in common matters more than either one individually: a defined entry, a defined exit, and a capped, pre-agreed level of risk on every single trade. Neither asks you to predict the market. Both simply ask you to follow a process consistently and let the structure do the work.
That consistency is really the point. The strategies themselves are a starting framework but the real skill beginners build is the discipline of sticking to rules they set in advance, rather than reacting in the moment. Most new traders don’t struggle because their strategy is wrong. They struggle because they abandon it on the third trade.
A practical way to build that discipline is to run both strategies on a demo account first, logging every trade against the checklist, until following the rules feels automatic rather than effortful.
Frequently asked questions
Is breakout trading good for beginners? Breakout strategies suit beginners well because the entry trigger is objective. Price either escapes the range or it doesn’t. The main risk is a false breakout, where price briefly exits the range then reverses, which is why the Breakfast Breakout uses a stop loss on the opposite side of the channel and a higher-timeframe trend check before entry.
What is a low test bar? A low test bar is a price bar where both the open and close sit in the upper half of the bar’s range. The long lower tail shows the market tested lower prices and rejected them. In the T-Wave Strategy, it’s used as confirmation that an existing uptrend is holding.
How much should a beginner risk per trade? We teach a maximum of 2% of account equity per trade. On a £10,000 account, that’s £200 of risk. This is calculated by reviewing the distance from entry to stop loss, multiplied by your position size. It should not exceed that figure.
What does 1:1 reward-to-risk mean? It means your profit target sits the same distance from your entry as your stop loss does. If your stop is 40 points below entry, your target is 40 points above it. At 1:1, you need to win slightly more than half your trades to be profitable after costs.
Do I need special software to trade these strategies? Both can be executed on any charting platform that supports EMAs and pending orders. SmartCharts draws the Breakfast Breakout channel automatically, which removes a manual step, but the underlying rules don’t depend on any single tool.
Can I use these strategies on any market? The Breakfast Breakout is designed for stock indices and commodities, which have defined session opens. The T-Wave Strategy is more flexible and can be applied to any trending market, including FX pairs.
Glossary
EMA (exponential moving average): A moving average that gives more weight to recent prices, so it responds faster to changes in direction than a simple moving average.
Pip: The smallest standard price increment in an FX pair. For most pairs, one pip is 0.0001.
Point: The smallest price increment on an index or commodity instrument; used in place of “pip” for these markets.
No-expiry order: A pending order that stays active until it triggers or you manually cancel it, rather than expiring at the end of the session.
Stop loss: A pre-set order that closes a trade at a defined level if the market moves against you, capping the loss on that trade.
Take profit / target: A pre-set order that closes a trade at a defined level of profit.
Reward-to-risk ratio: The relationship between the distance to your target and the distance to your stop loss. A 1:1 ratio means both are equal.
Range / channel: The area between a defined high (ceiling) and low (floor) over a given period.
Breakout: A move in price beyond an established range boundary.
Higher timeframe: A longer-interval chart (e.g. 4-hour or daily) used to check the broader trend context behind a shorter-term setup.
Keep learning
If you found this useful, there’s plenty more to explore. Take a look through our wider trading education library as you build out your approach.
Trading carries risk. The strategies described here are educational and are not a recommendation to trade any particular instrument. Past performance is not a reliable indicator of future results, and you should never risk more than you can afford to lose.
—–
¹ Bank for International Settlements, OTC foreign exchange turnover in April 2025, Triennial Central Bank Survey, 30 September 2025: bis.org/statistics/rpfx25_fx.htm
² Financial Conduct Authority, FCA warns investors in CFDs risk losing out on protections, 30 October 2025: fca.org.uk/news/press-releases/fca-warns-investors-cfds-risk-losing-out-protections