


Technical analysis is the skill of reading price charts to anticipate where a currency pair is likely to go next, and crucially, where to enter and exit trades with the odds in your favour. It’s one of the two main ways traders analyse markets (the other being fundamental analysis, which we’ll explain below), and it’s the foundation of Learn to Trade’s methodology.
In this guide you’ll learn:
- What technical analysis is
- How it differs from fundamental analysis
- How to find entry and exit points
What Is Technical Analysis?
Technical analysis is the study of past price movements on charts to forecast the likely future direction of a currency pair, and to identify possible entry and exit points. Rather than reading company reports or economic data, a technical trader reads the price itself.
It rests on three core assumptions, in plain English:
- Price already reflects all available information: everything known about a currency is assumed to be baked into its current price.
- Prices move in trends: moves tend to persist in a direction rather than being purely random.
- History tends to repeat: recognisable patterns in how people buy and sell show up again and again.
It also helps to picture how markets move. A currency pair rarely travels in a straight line. Instead it “breathes” or zig-zags, drifting sideways, pushing up, pulling back down, in a series of waves.
Technical analysis is about reading those swings so you can time your entries and exits with the odds a little more on your side.
One important expectation to set from the start: technical analysis is a probability tool, not a crystal ball. It’s designed to improve the likelihood that a trade works out, never to predict the market with certainty.
Technical Analysis vs. Fundamental Analysis
The two main schools of market analysis answer different questions.
- Technical analysis reads the price and the chart – the patterns, levels and trends that price creates.
- Fundamental analysis reads the drivers behind the price – economic data, interest rates, central-bank decisions and news.
Neither is inherently “better,” and they aren’t mutually exclusive. Many experienced traders use both: fundamentals to understand why a market might move, and technicals to decide when and where to act.
For a beginner, technical analysis is usually the more approachable starting point. That being said, staying aware of major scheduled news matters too, because a single high-impact announcement can override any chart pattern.
Reading Price Charts
Charts are your primary tool. They show what a currency pair has cost over a chosen timeframe. This can be from one minute to one month per data point.
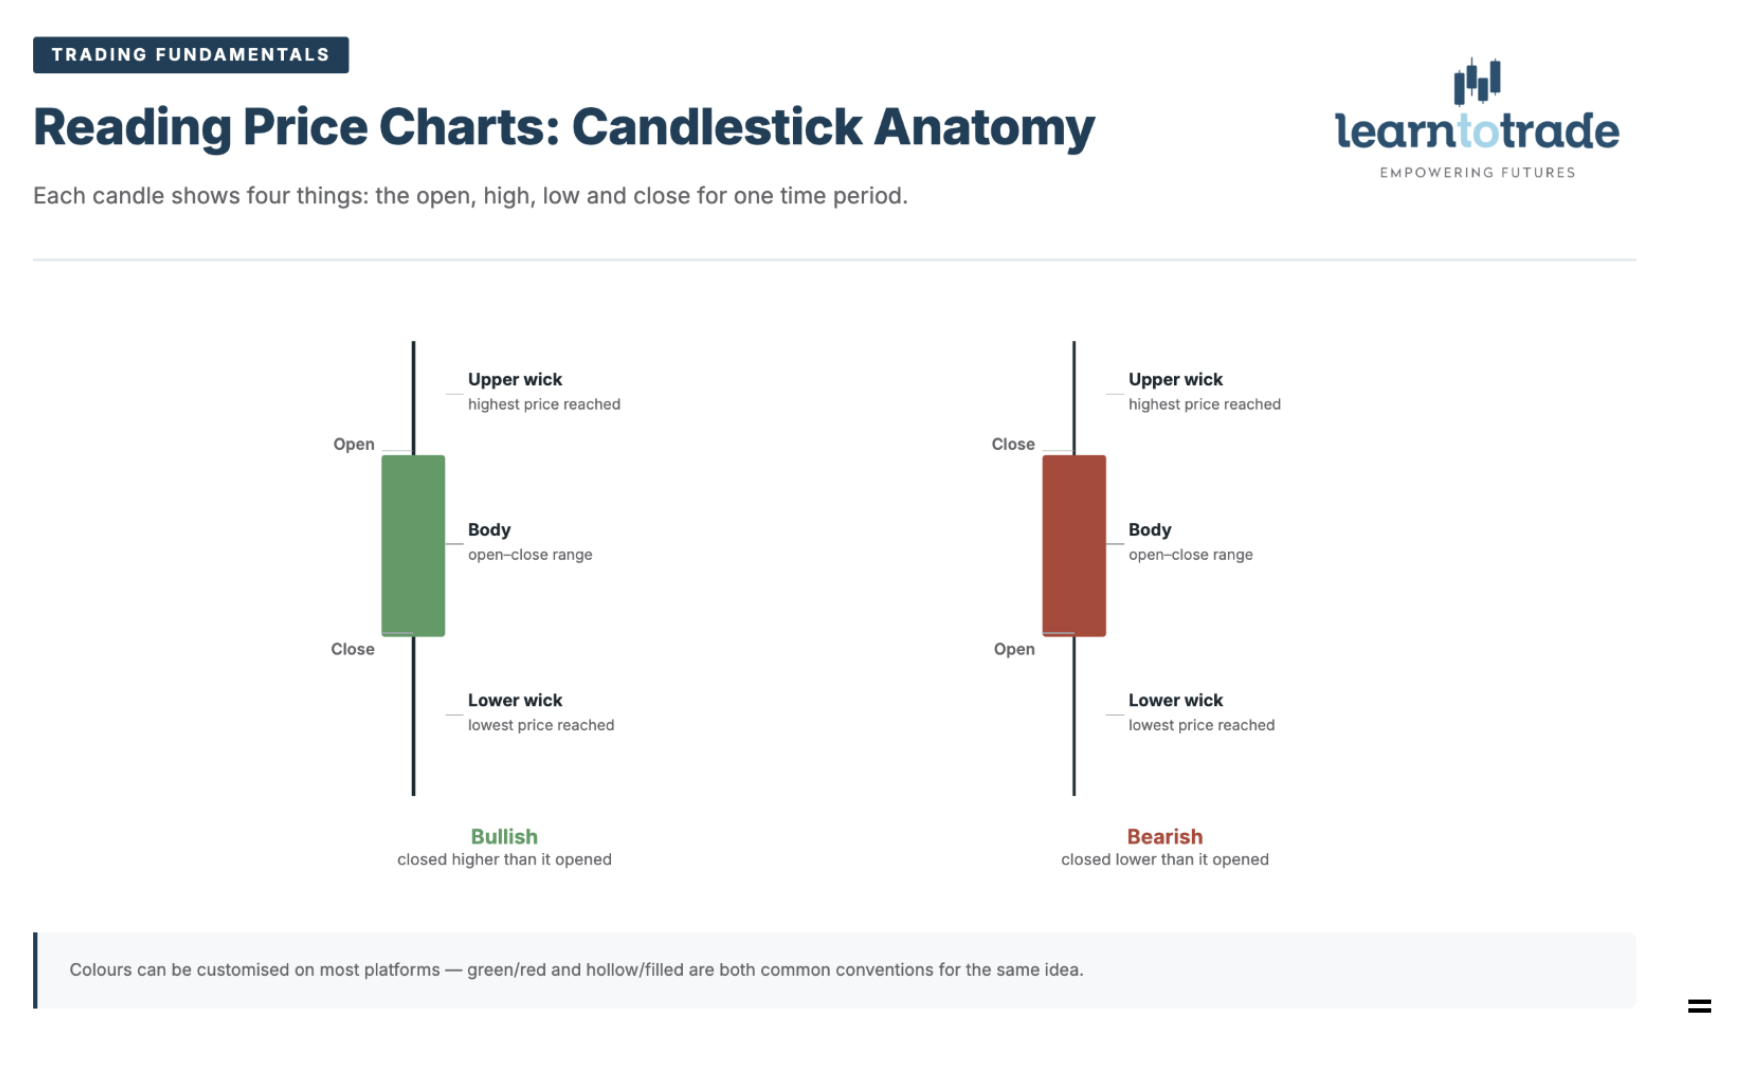
Candlestick charts are the most widely used in forex. Each “candle” represents the price action for one time period and shows four things: the open, high, low and close.
- The body shows the distance between the open and close.
- The wicks (or “shadows”) above and below show the highest and lowest prices reached.
- By convention, a green (or hollow) candle means price closed higher than it opened, and a red (or filled) candle means it closed lower. (These colours can be customised on most platforms.)
Other chart types exist such as simple line charts (closing prices joined up) and bar charts. But, candlesticks are the standard for technical analysis because a single candle communicates so much about the balance between buyers and sellers.
Support and Resistance
Two of the most useful concepts in technical analysis are support and resistance. Think of them as the floor and ceiling of the market.
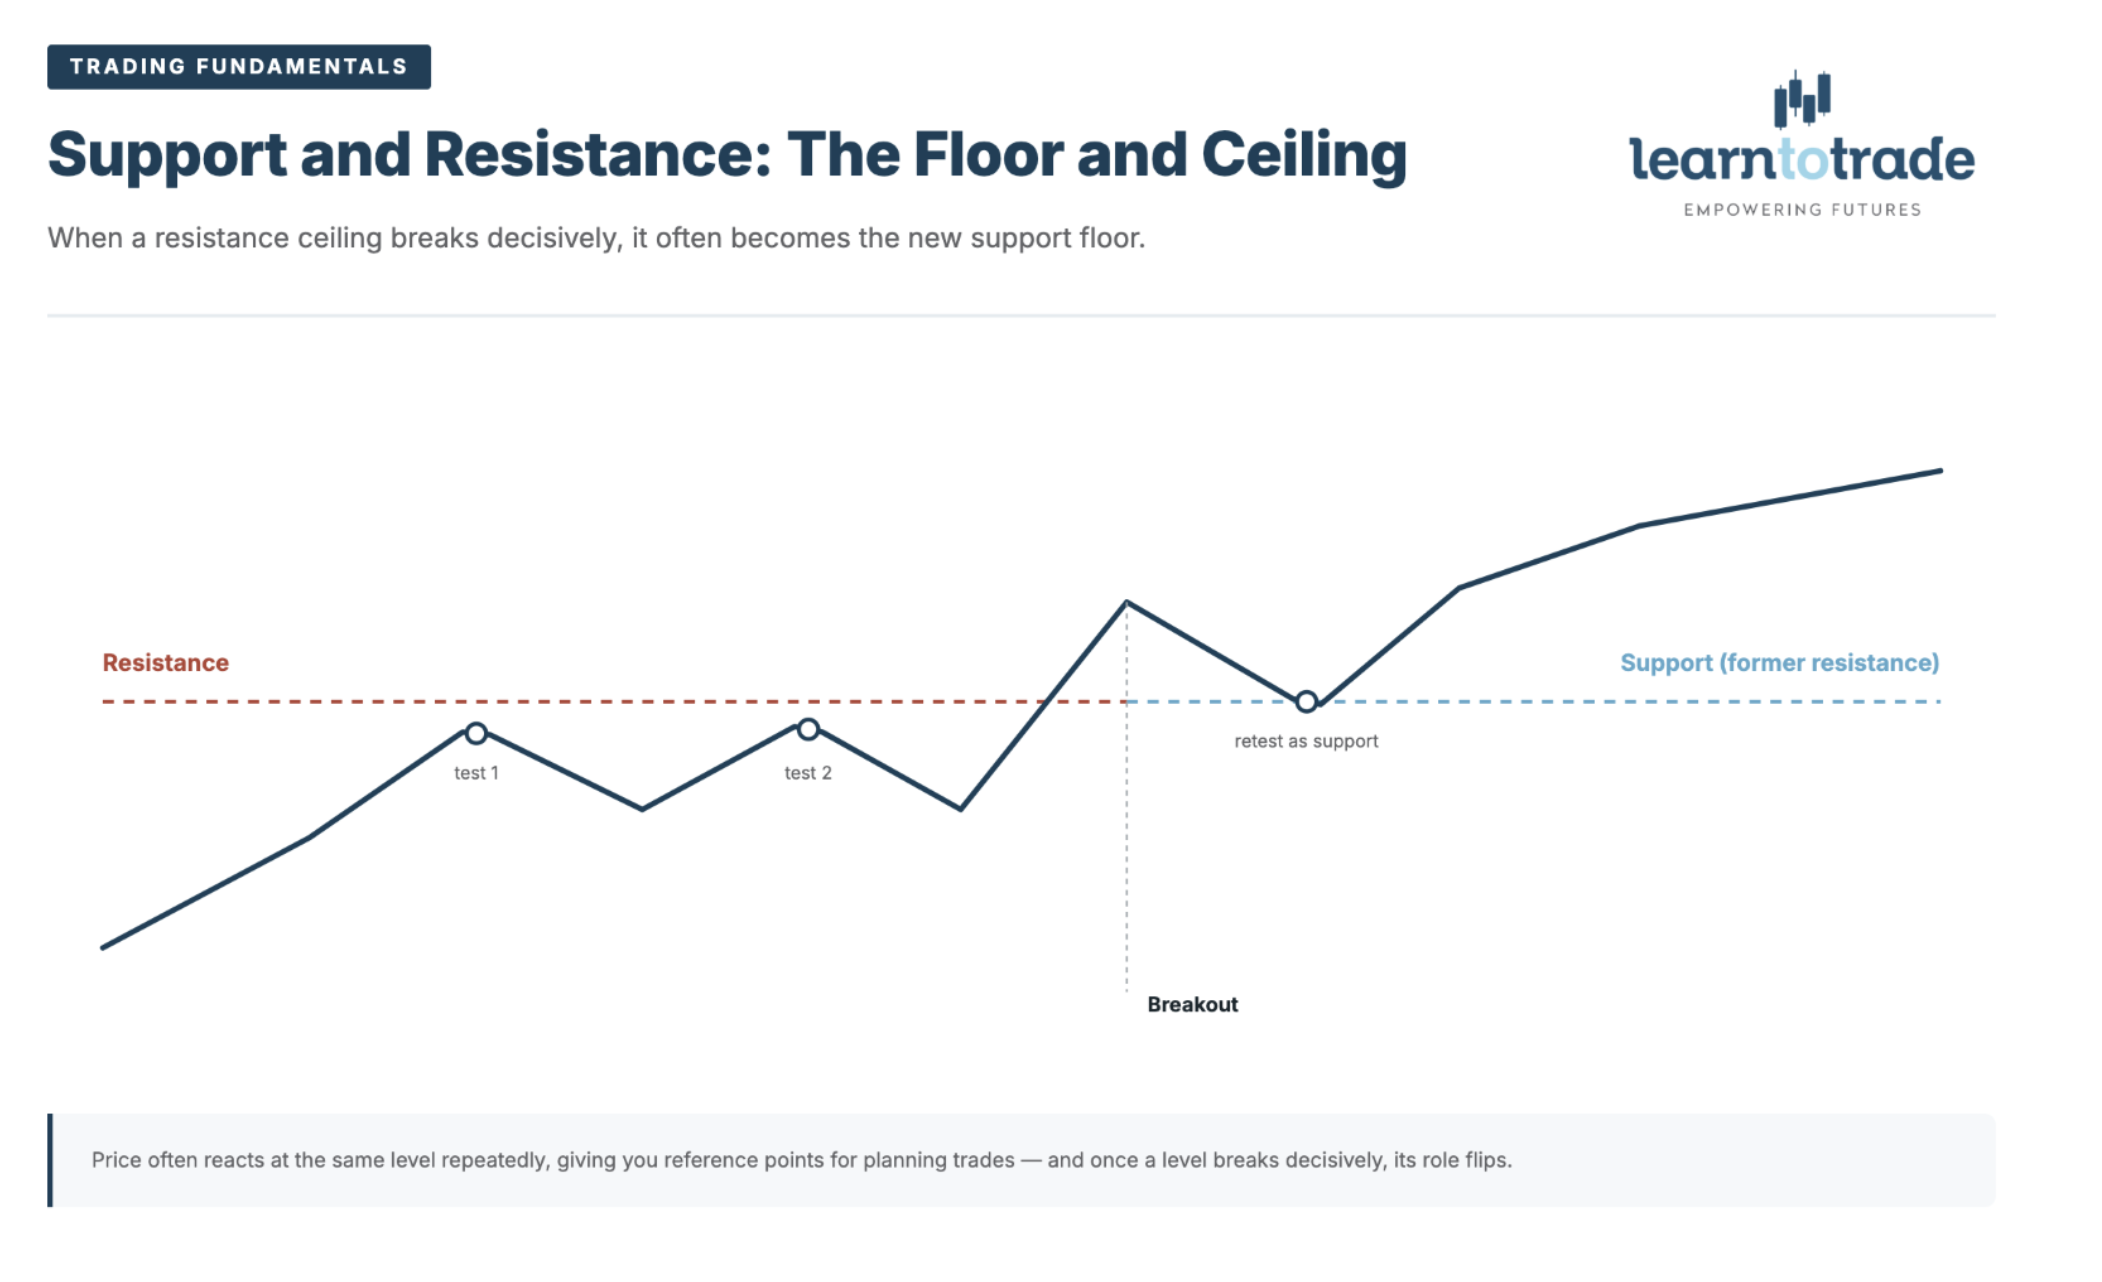
- Support is the price “floor.” As price falls toward a support level, it tends to stall because buyers step in, seeing value.
- Resistance is the price “ceiling.” As price rises toward a resistance level, it tends to stall because sellers step in, taking profit.
These levels matter because price often reacts at them repeatedly, which gives you reference points for planning trades. A trader might look to enter near support in an uptrend, or set a profit target just below resistance.
One of the most important behaviours to understand is role reversal: when price decisively breaks through a resistance ceiling, that old ceiling frequently becomes the new floor (support). And, when price breaks down through support, the old floor can become the new ceiling.
Market Trends
The trend is the general direction of price, and there’s a reason the oldest saying in trading is “the trend is your friend.”
Trading with the trend, rather than against it, puts probability on your side.
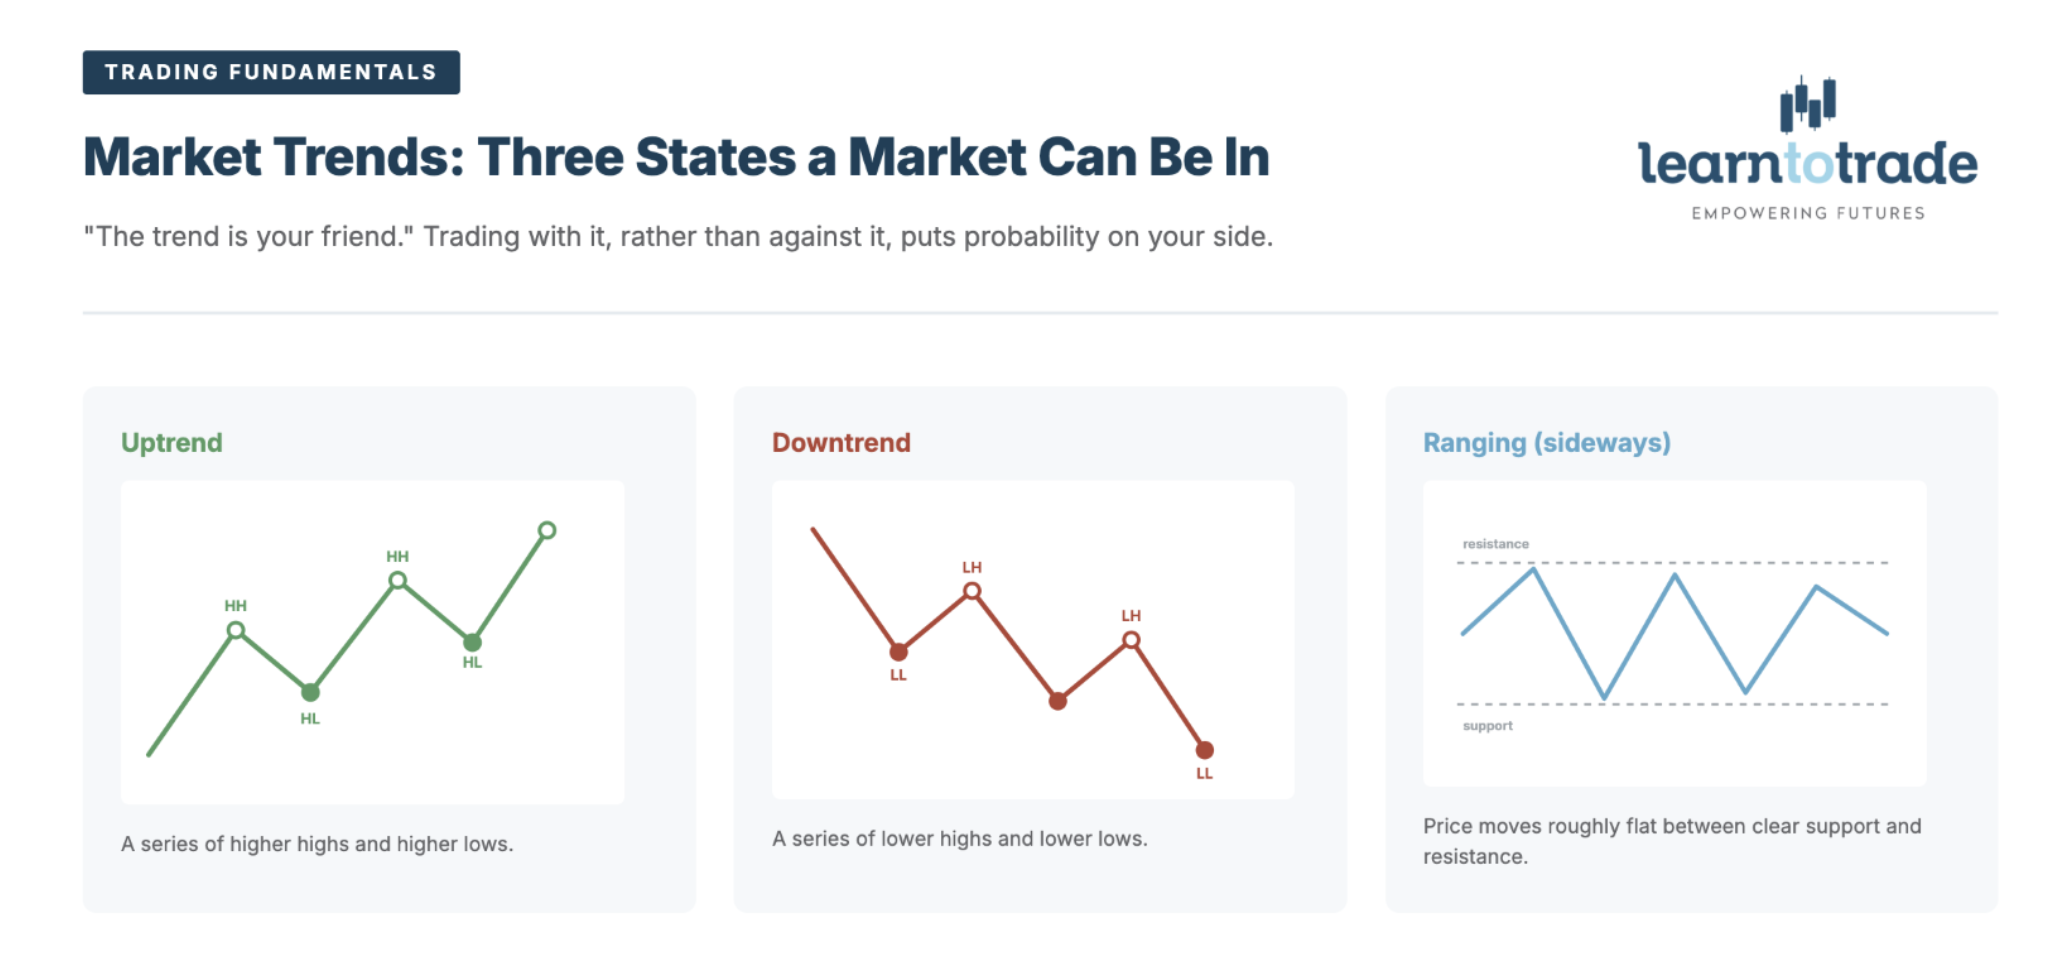
There are three states a market can be in:
| Trend | What it looks like |
| Uptrend | A series of higher highs and higher lows |
| Downtrend | A series of lower highs and lower lows |
| Ranging (sideways) | Price moves roughly flat between clear support and resistance |
Identifying the trend comes before choosing a strategy, because different conditions call for different approaches. you’d trade a strong trend very differently from a quiet, ranging market. Misreading the trend is one of the most common beginner mistakes.
Indicators: The Basic Toolkit
Indicators are mathematical tools calculated from price data. They help organise what you’re seeing on the chart. Remember, they are aids, not crystal balls, and they lag price to some degree. Two are worth knowing from the start.
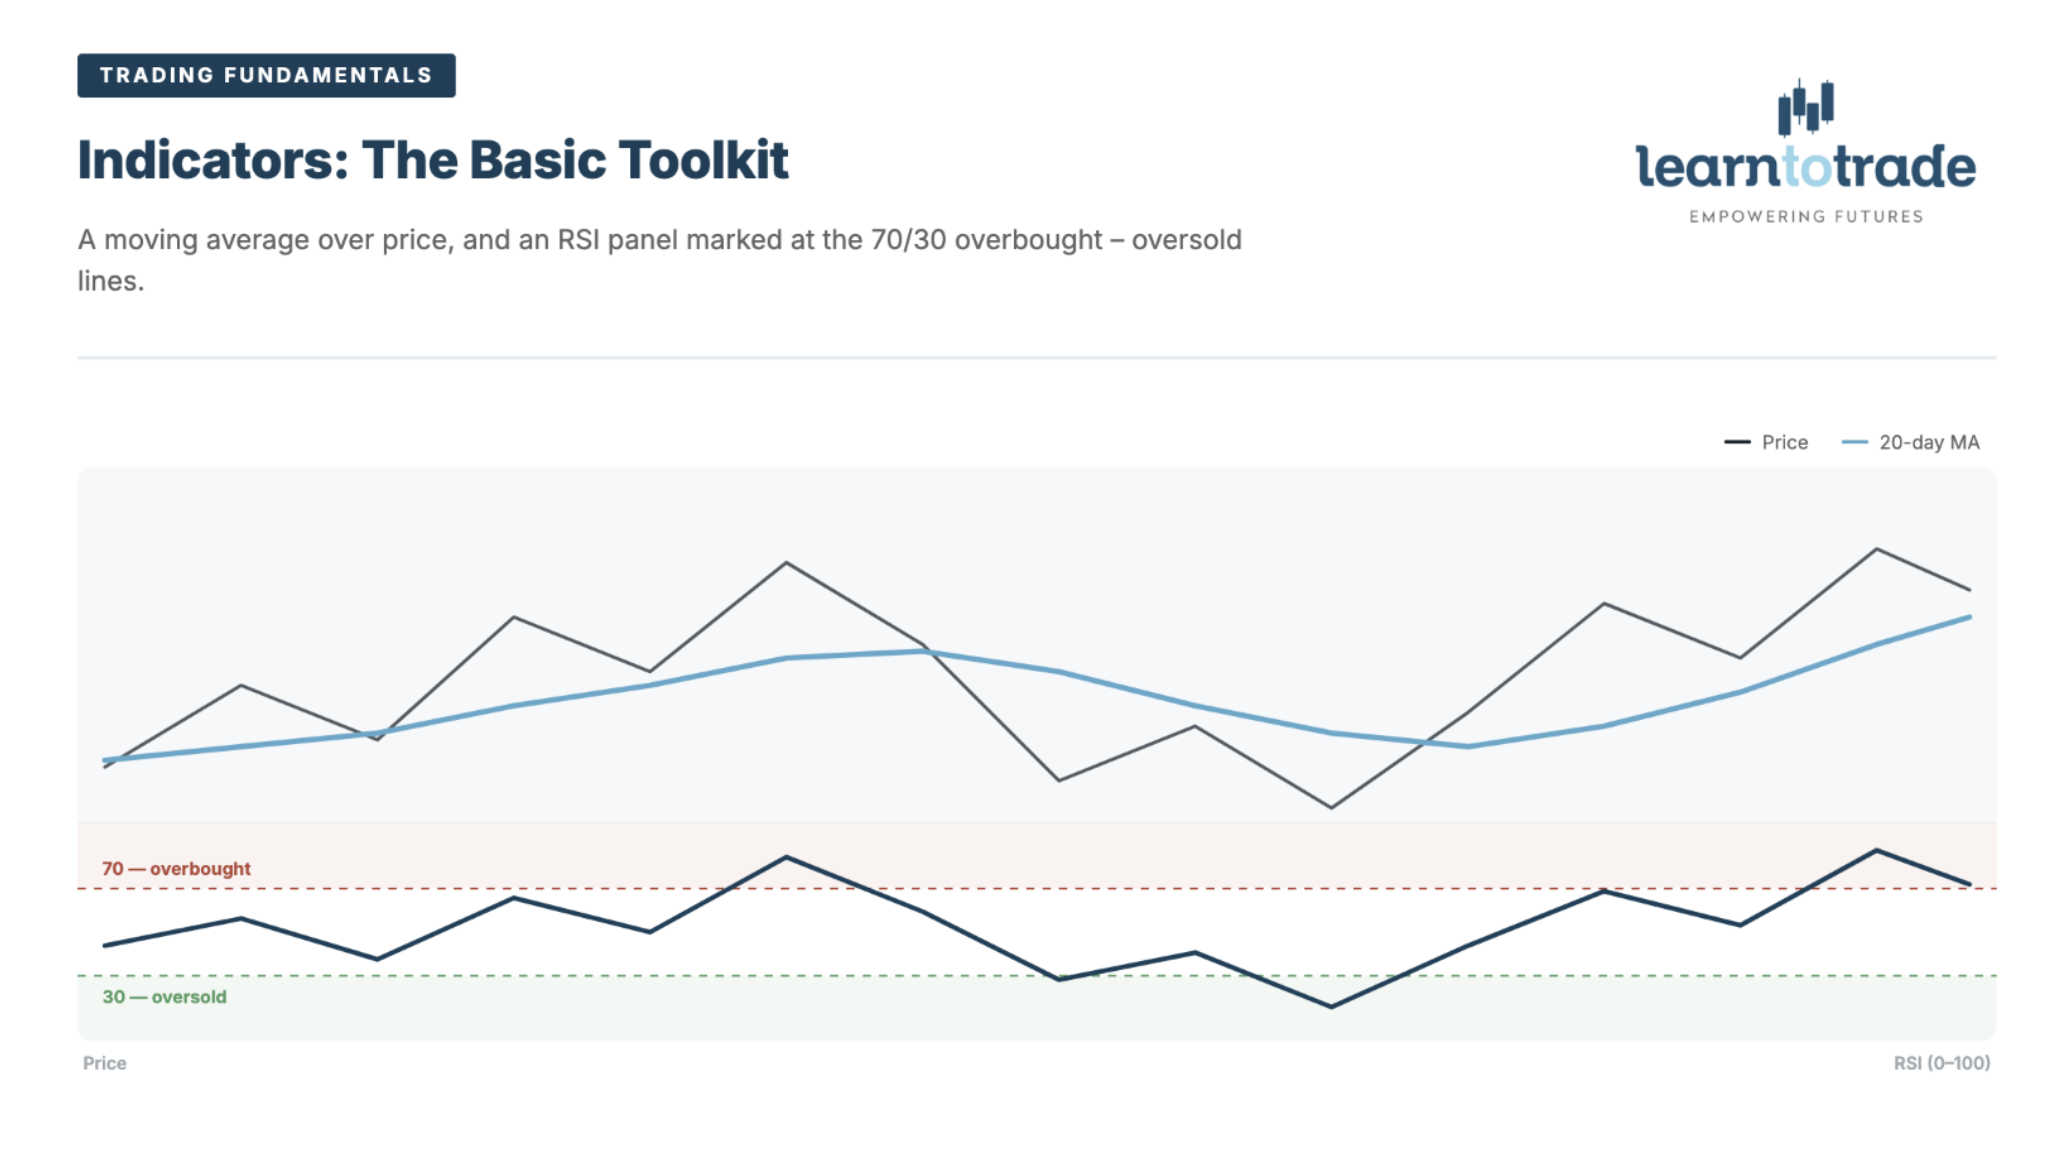
Moving Average (MA). A moving average smooths out short-term noise to reveal the underlying trend. A 20-day MA, for example, plots the average closing price of the last 20 days as a single line. A Simple Moving Average (SMA) weights each period equally; an Exponential Moving Average (EMA) gives more weight to recent prices, so it reacts faster. Traders often use the slope and position of an MA to gauge trend direction.
Relative Strength Index (RSI). The RSI is a momentum oscillator that moves between 0 and 100. By convention, a reading above 70 suggests a currency may be “overbought” (the move up may be stretched), and below 30 suggests it may be “oversold” (the move down may be stretched).
The golden rule: no single indicator is reliable on its own. Disciplined traders look for confluence (several signals pointing the same way) before acting.
The Learn to Trade Approach: A Systematic, Rule-Based Method
Everything above is the toolkit. The harder part, and where most beginners come unstuck, is applying it with consistency.
Learn to Trade’s approach is built around turning these fundamentals into a repeatable, rule-based system, so decisions come from a plan rather than emotion.
(The following is an educational overview of the methodology, not trade signals or advice.)
The Three-Pillar structure. Every strategy sits inside the same educational matrix:
- Fundamentals & Technicals (70%): clean chart setups using tools like pivot points and moving averages, while keeping an eye on high-impact news.
- Trading Psychology (15%): removing emotion by relying on pending, pre-set orders rather than executing manually in the moment.
- Money Management (15%): strict risk control, typically risking no more than 2% of the account per trade.
Notice that two of the three pillars are about discipline and risk, not chart-reading. A deliberate reminder that technique alone isn’t enough.
Core strategies, at a conceptual level. The methodology teaches a small number of defined setups so beginners aren’t overwhelmed:
- T-Wave (trend/reversal): a mechanical, beginner-oriented setup. A longer-period simple moving average on a higher timeframe (such as H4 or Daily) is used to read the baseline direction; the “trigger” is a rejection candle (a bar with a long wick pushing back from a key zone, similar to a hammer or shooting star); entry is planned with a pending stop order just beyond the candle, with the stop-loss on the opposite side.
- Power Pivot (over-extension): uses pivot points to fade extreme moves. It waits for price to over-stretch to outer pivot levels that line up with a significant daily support or resistance area, then looks to trade the snap-back through the main pivot.
- Trend Breakout: looks for a prevailing trend line breaking, followed by a tight sideways consolidation against a horizontal level; a pending breakout order is placed just outside that range, aiming for a risk-reward ratio of at least 1:1.
Each of these is only ever taught alongside the money-management pillar, a stop-loss and 2% risk on every trade. No setup is presented as a guaranteed winner; the point of a rule-based system is consistency, not certainty.
Execution discipline (ie.”sit on your hands”). A defining part of the approach is when to trade. It emphasises high-liquidity windows, primarily the London/New York overlap, where price moves tend to be cleaner.
If a planned setup doesn’t trigger during the expected session, the discipline is to cancel the pending order rather than leave it hanging into thin, low-volume hours where behaviour is less predictable.
Knowing when not to trade is treated as a skill in its own right.
Frequently Asked Questions
Does technical analysis actually work? It’s a probability tool used by professionals and institutions worldwide with success, but it isn’t a guarantee. It helps you find higher-probability setups; it does not remove risk. Anyone promising certainty from a chart pattern should be treated with caution.
Can I rely on technical analysis alone? It’s rarely wise to. Pair it with strict risk management, and stay aware of major scheduled news, which can move markets regardless of what the chart says.
How long does it take to learn? Realistically, months of study and practice, or working hand in hand with a coach to get you started faster with real time feedback. Reading charts is a skill that develops with repetition, not just a weekend course on its own.
Do I need paid software? Not to learn, however we highly recommend SmartCharts to anyone and everyone looking for a great tool to accompany them on their trading journey.
Conclusion
Technical analysis is, at its core, the disciplined reading of price to find higher-probability entries and exits.
Three things to take away: technical analysis improves your odds but never removes risk; stop-losses and position sizing should be a non-negotiable; and a consistent, rule-based method beats guesswork every time.
That last point is the whole idea behind how Learn to Trade teaches technical analysis, as a disciplined, rule-based system where structure comes first, so beginners understand why a setup works, not just what to click.
Full risk disclaimer
This article is educational content and does not constitute financial, investment or trading advice. Forex and CFD trading carries a substantial risk of loss and is not suitable for every investor. The majority of retail investor accounts lose money. Technical analysis is a probability tool and does not guarantee results. Past performance does not guarantee future results. Trade only with capital you can afford to lose, and seek independent advice if you are unsure.